
Destination real estate investment is diverging along structural lines, and drive-to markets are pulling ahead. Properties within two to three hours of major metropolitan areas are outperforming fly-to resort destinations on occupancy stability, pricing power, and resilience during travel disruption—and the reasons have less to do with post-pandemic trends than with fundamental shifts in how guests spend, how operators generate revenue, and how capital markets price hospitality assets.
Full-year 2025 US hotel data marked an inflection: the first simultaneous decline in occupancy and RevPAR since 2020 (CoStar / IDeaS). But the decline was not evenly distributed. Luxury and upper-upscale RevPAR rose 5.3% while economy hotels declined 1.8%. For accredited investors evaluating destination hospitality, the question is no longer whether the market is splitting—it is which side of the split a given asset falls on, and why.
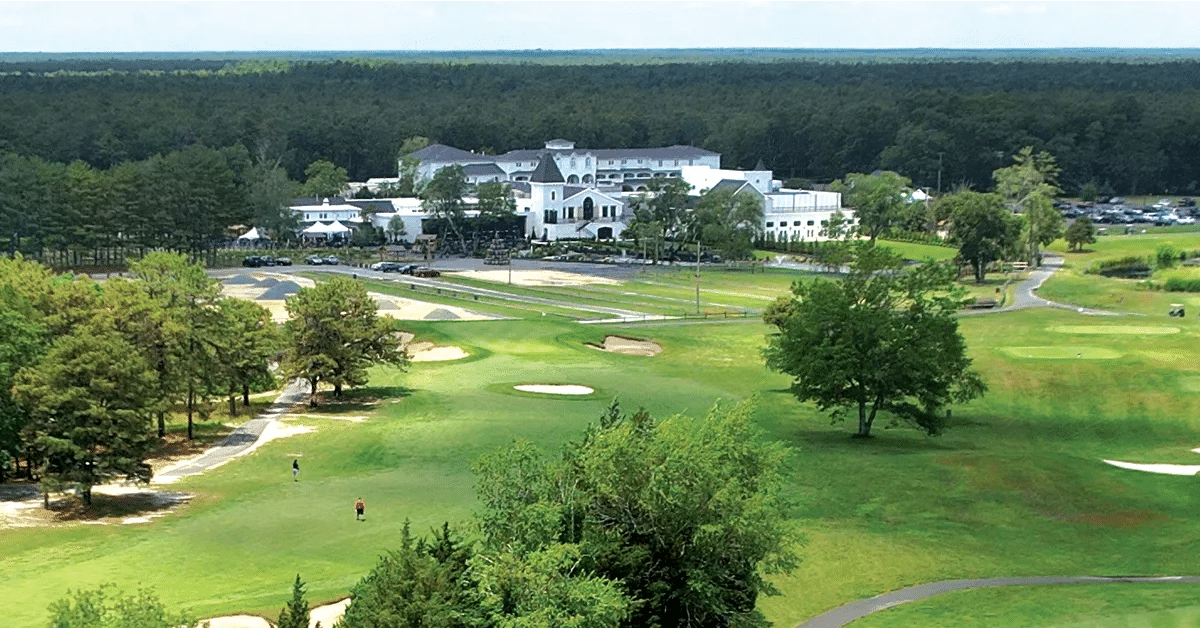
Renault Winery Resort, Egg Harbor City, NJ — a drive-to destination resort owned by the funds offered by Accountable Equity and operated by VIVÂMEE Hospitality. Multi-revenue-stream properties like this generate TRevPAR well above what conventional RevPAR captures.
The Structural Shift from Transactional to Experiential Hospitality
The 2025 K-shaped hospitality performance is not a one-year anomaly. It reflects a durable demand migration from transactional lodging—where a room is a commodity and the lowest rate wins—to experiential hospitality, where guests pay for a place to be, not just a place to sleep. Short-term rental demand grew 6.0% in 2025 while hotel demand contracted 0.3% (STR / AirDNA). The short-term rentals gaining share are experiential: unique cabins, historic farmhouses, private estates. They take guests from commoditized hotels, not from character-rich destination resorts.
Drive-to-destination properties sit at the center of this migration. A resort within two to three hours of a major metro—reachable on a Thursday afternoon without a flight—captures a structurally different guest. The marginal cost is a tank of gas, the booking lead time is shorter, the repeat visitation rate is higher, and the guest’s willingness to pay for experience is embedded in the decision to drive to a destination rather than booking the nearest available room.
Generational capital flows reinforce the trend. Millennials are entering the luxury resort market in meaningful numbers, driven by wealth transfers, remote work flexibility, and a documented preference for experiential spending over material consumption, according to KPCW’s April 2026 analysis. The demand tailwind is demographic, not cyclical.
Why Drive-to Destination Real Estate Holds Occupancy Under Pressure
Fly-to resorts face a demand equation that works against them in any period of economic friction. When airfare rises, consumer confidence softens, or travel disruption introduces uncertainty, the guest’s calculus changes immediately. A $3,000 flight for a family of four competes with every other discretionary budget category. Drive-to destinations face a fundamentally different equation: the cost of participation is a tank of gas, the psychological barrier is smaller, and the frequency of visitation is structurally higher.
The mid-Atlantic corridor illustrates this depth of advantage. Properties on Maryland’s Eastern Shore and the southern New Jersey coast sit within driving range of Baltimore, Washington D.C., Philadelphia, and greater New York City—a combined population base exceeding 30 million people. These are not remote leisure markets dependent on airline capacity. They draw from a deep, recurring demand pool that replenishes week after week.
For investors, this translates directly to revenue predictability. A hospitality asset sustaining strong occupancy during a soft quarter because its demand base is local and recurring represents a fundamentally different risk profile than a fly-to resort that sees sharp declines when air travel contracts. CoStar and Tourism Economics downgraded 2026 US hotel RevPAR growth forecasts to just 0.6%, citing tariff headwinds and reduced international inbound travel—but luxury and upper-upscale segments consistently outperform in soft environments, and drive-to positioning amplifies that resilience.
The Multi-Revenue-Stream Advantage: Why TRevPAR Tells the Real Story

Bohemia Manor Farm, Chesapeake City, MD — owned by the funds offered by Accountable Equity and operated by VIVÂMEE Hospitality. Contracted events like vineyard dinners and weddings book months in advance, contributing to the forward revenue visibility that distinguishes destination hospitality from transient-room-dependent hotels.
RevPAR—Revenue Per Available Room—measures how effectively a hotel monetizes its room inventory. For a transactional hotel where rooms represent 70–80% or more of total revenue, RevPAR is a reasonable proxy. But for a drive-to destination resort operating rooms, food and beverage, spa, golf, weddings, membership, and retail through the same property, RevPAR captures perhaps a third of what the business actually does.
TRevPAR—Total Revenue Per Available Room—captures all of it. At a mature, well-diversified boutique resort, TRevPAR routinely runs two to three times higher than RevPAR alone. A property showing $180 in RevPAR may generate $380 to $500 in TRevPAR. The 2025 transaction market validated this metric: JW Marriott Phoenix Desert Ridge sold for $865 million and PGA National Resort for $422.5 million (Hotel Dive / CoStar). Both were underwritten on total resort revenue because of the depth of their golf, spa, event, and food and beverage operations.
Each revenue layer compounds rather than simply sums. A guest who comes for a wedding, uses the spa, plays golf, and dines on property generates three to four times the revenue of a transient room-only guest at the same ADR. The contracted event layer is particularly powerful: a single peak-season wedding weekend—venue fee, food and beverage minimum, lodging block, rehearsal dinner, brunch—can represent tens of thousands of dollars from a single event. Across 40 to 60 event dates per year, that becomes a dominant TRevPAR contributor and a source of forward revenue visibility extending 12 to 18 months.
Investors evaluating destination hospitality should demand TRevPAR data alongside RevPAR, examine the revenue mix by department, and assess growth runway in underdeveloped ancillary streams. ADR and RevPAR alone will understate the operating power of any property with meaningful non-room revenue. For a deeper discussion of how experienced operators evaluate and structure multi-revenue hospitality assets, visit accountableequity.com.
Capital Market Dynamics Favor Drive-to Destination Real Estate
The capital markets are reinforcing the drive-to thesis from the supply side. A $48 billion CMBS maturity wall is hitting hospitality in 2025–2026, according to Crexi and S&P Global Ratings. Borrowers who financed at 3–4.5% in 2020–2022 now face refinancing at 6.25–7%—roughly 40% higher debt service—forcing distressed sales among undifferentiated properties. Hotel CMBS delinquency reached 7.31% in March 2026, with 40–45% of full-service hotel loans flagged as troubled or in special servicer status.
That stress is concentrated, not evenly distributed. Commoditized hotels face three simultaneous headwinds: a debt refinancing crisis, a demand shift away from transactional lodging, and intensifying short-term rental competition. Boutique drive-to resorts with strong operating metrics face none of these at the same intensity—and benefit from every guest dollar that migrates from transaction to experience.
Post-pandemic capital market liquidity for boutique hotels grew 55%, compared to just 3% for branded properties, according to Cloudbeds’ 2026 State of Independent Hotels report. Private credit is actively seeking quality boutique collateral—Peachtree Group deployed a record $3 billion in 2025 (87% year-over-year increase), including $1.1 billion in hotel loans. The market is pricing in what operating data already shows: character-rich, multi-revenue destination properties represent a structurally different risk-return profile. To learn more about how Accountable Equity structures its offerings, visit accountableequity.com.
What Investors Should Evaluate in Destination Real Estate
Not every drive-to property benefits equally from these tailwinds. The advantages accrue most powerfully to properties combining several reinforcing characteristics, and investors should evaluate the full picture before concluding that drive-to positioning alone is sufficient.
Population base depth matters more than proximity alone. A property within range of three or four major metros has a fundamentally different demand profile than one accessible from a single mid-size city. Revenue diversification is equally critical: a destination property relying solely on transient room revenue faces the same cyclical risk as a fly-to resort. The strongest drive-to properties operate across multiple streams—rooms, food and beverage, weddings, golf, memberships, spa, and experiential programming.
Operator quality completes the picture. Multi-revenue-stream destination hospitality is operationally intensive—managing simultaneous events, seasonal staffing, and diverse guest programming requires depth most generalist operators do not possess. That complexity is both the challenge and the barrier to entry: it limits competition and rewards experienced operators disproportionately. For a framework on evaluating a real estate syndication sponsor, start with the operator’s track record across multiple property types and revenue models.
Boutique Drive-to-Destination vs. Commoditized Hotel — At a Glance
| Attribute | Boutique Drive-to-Destination | Commoditized / Branded Hotel |
| Primary Revenue Model | Rooms + F&B + Spa + Golf + Events + Membership | Primarily rooms; F&B often minimal or outsourced |
| Occupancy Sensitivity | Partial — non-room revenue cushions slow periods | High — entire P&L tied to room occupancy |
| Guest Loyalty Driver | Emotional attachment to place and experience | Points programs and brand familiarity |
| OTA Dependency | Lower — strong direct booking from repeat guests | High — 63.4% average for independents (Cloudbeds 2026) |
| Pricing Power Source | Irreplicable historic character and experiential identity | Rate compression from competitive supply |
| Post-Pandemic Capital Market Liquidity | +55% growth (Cloudbeds 2026) | +3% growth |
| TRevPAR vs. RevPAR | TRevPAR typically 2–3× RevPAR | TRevPAR ≈ RevPAR — minimal ancillary revenue |
Investment opportunities in private real estate syndications are available only to accredited investors as defined by applicable securities laws. Each investor should conduct their own due diligence before making any investment decision.
Frequently Asked Questions
What is a drive-to destination market in real estate investing?
A drive-to destination market is a hospitality corridor reachable by car within two to three hours from one or more major metropolitan areas. Properties in these markets benefit from a large, recurring local demand base independent of airline access, resulting in higher repeat visitation, lower guest acquisition costs, and structural resilience to travel disruptions and economic slowdowns.
What is TRevPAR and why does it matter for destination hospitality?
TRevPAR stands for Total Revenue Per Available Room. It measures all revenue a property generates—rooms, food and beverage, spa, golf, events, membership, and retail—divided by total available room nights. For multi-revenue destination resorts, TRevPAR typically runs two to three times higher than RevPAR and provides a far more accurate picture of operating power and investment value.
Why are capital markets favoring boutique drive-to resorts over commoditized hotels?
Post-pandemic capital market liquidity for boutique hotels grew 55% versus just 3% for branded properties (Cloudbeds 2026). A $48 billion CMBS maturity wall is creating refinancing stress concentrated in undifferentiated assets. Demand migrating toward experiential hospitality, distress in commoditized segments, and institutional appetite for character-rich assets have created favorable conditions for well-operated boutique drive-to properties.
The Structural Case for Drive-to Destination Real Estate
The hospitality market’s K-shaped divergence reflects structural shifts in guest demand, revenue model superiority in multi-stream destination properties, and capital market dynamics that create stress for commoditized assets while favoring boutique drive-to destinations. Properties on the right side share reinforcing characteristics: drive-to geography accessing deep metro populations, diversified TRevPAR stacks generating two to three times room-only revenue, contracted event pipelines providing forward visibility, and operators with depth to execute across genuine operational complexity.
For accredited investors, destination real estate investment in drive-to markets deserves serious evaluation—not because the segment is immune to risk, but because the structural factors favoring it are durable, measurable, and compounding. To explore how experienced sponsors approach destination hospitality investment, visit accountableequity.com.